


 当前位置:
当前位置:MAX-IDE Simulator User's G
[09-13 17:04:09] 来源:http://www.88dzw.com 控制技术 阅读:8333次
文章摘要:The above source code is available at: http://files.dalsemi.com/microcontroller/maxq/app_note_software/MAX-IDESimUsersGuide.zip (ZIP)Step 9: Recompile the code by pressing F7 or selecting Project?Make. If compilation is successful, output files named hextoasc.hex and hextoasc_d.hex will be generated
MAX-IDE Simulator User's G,标签:计算机控制技术,工厂电气控制技术,http://www.88dzw.comThe above source code is available at: http://files.dalsemi.com/microcontroller/maxq/app_note_software/MAX-IDESimUsersGuide.zip (ZIP)
Step 9: Recompile the code by pressing F7 or selecting Project?Make. If compilation is successful, output files named hextoasc.hex and hextoasc_d.hex will be generated along with a list file. You are now ready to run the application.
Step 10: Before executing the application, set some break points to investigate the application's behavior. Click on the line number at the left edge of the editor window to set a breakpoint. The breakpoint will be indicated by a • to the side of the number. Set a break point on the line below "main," and another at the subroutine, Hex2Asc. Press F5 to start the simulator. This will save the files (if not already saved) and compile the project. If the compilation is successful, the simulator will load the file and start running. When the simulator hits a break point, the program execution will pause at the current line, as indicated by highlighting of the current line and a → mark to the left of the margin.
Figure 5 shows the breakpoint and an instance of the application running.

Figure 5. The Debug Windows with the breakpoint indicated by the green arrow and line.
Step 11:Open up the registers window by clicking on Window→Show→Registers from the Window menu. Select SYSTEM from the Registers drop-down box to display the MAXQ core registers' contents. Observe that relevant registers are updated as you step through the execution. Try the commands step into, step over, step out, and run to cursor to become familiar with the MAX-IDE. Similarly, if your program is writing to the data memory and you want like to watch the data values, go to Window→Show→Memory, tab to "data" memory, and scroll down to the memory location to observe the values.
The above program converts the hex value supplied in the A [0] register to its equivalent ASCII value, and stores the ASCII values in the data memory addresses 0x00 and 0x02.
Execute the application for different values in the A [0], and observe their equivalent ASCII values in data memory addresses 0x00 and 0x02.
Refer back to Figure 4. A [0] is set to 0x41 HEX in the registers window; data memory location 0x00 and 0x02 are updated with 0x34 and 0x31 respectively, which are the ASCII equivalent of 0x41 hex.
Step 12: Open the Statistics window (Window→Show→Statistics). This action shows you the machine cycles and execution time (Figure 5).
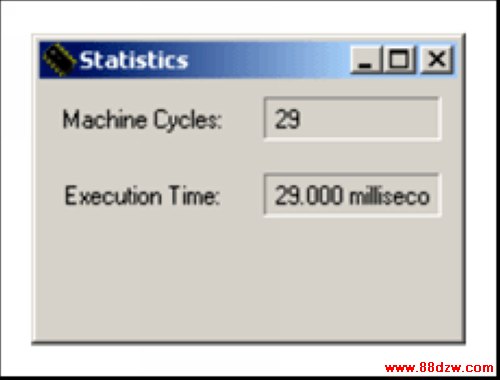
Figure 6. The Statistics window lets you monitor machine cycles and execution time.
Conclusion
MAX-IDE, the MAXQ device simulator, can be used to develop and debug the MAXQ-based applications for the MAXQ10, MAXQ20, and MAXQ30 devices. The application developed with MAX-IDE is ready to run on the hardware.
Tag:控制技术,计算机控制技术,工厂电气控制技术,控制技术
《MAX-IDE Simulator User's G》相关文章
- › MAX-IDE Simulator User's G
- › MAX-IDE入门
- › Automatically Initializing Data Segment Values in MAX-IDE
- 在百度中搜索相关文章:MAX-IDE Simulator User's G
- 在谷歌中搜索相关文章:MAX-IDE Simulator User's G
- 在soso中搜索相关文章:MAX-IDE Simulator User's G
- 在搜狗中搜索相关文章:MAX-IDE Simulator User's G
分类导航
最新更新